

Feature Spotlight: Yogi’s AI Lets You Build and Interpret Charts and Dashboards
What if the fastest way to understand a dashboard was simply to ask it?
Most dashboards answer the questions someone thought of when they built them. The next question is the hard one. Why did this move? What’s driving it? Can I see it by retailer instead?
Answering it usually means digging through filters, rebuilding a chart, or waiting on the one person on your team who knows how. That’s why Ask Yogi, Yogi’s AI assistant, works right alongside your charts and dashboards to close that gap. It understands what you’re looking at, so you can ask about it, change it, or build something new in plain language.
The Gap Between Data and Answers
Consumer feedback is some of the richest data a brand has. Every review, support ticket, and social post tells you something about your products. But the value only shows up if people can actually work with it.
For many teams, that’s where things stall. A brand manager wants to know why a rating dropped. A product lead wants the same view for a different market. A new team member opens a dashboard for the first time and isn’t sure what they’re looking at.
None of these people should need to understand metrics, breakdowns, and filter logic to get their answer. They just need to know what question to ask.
Ask Yogi, Right Where You’re Working
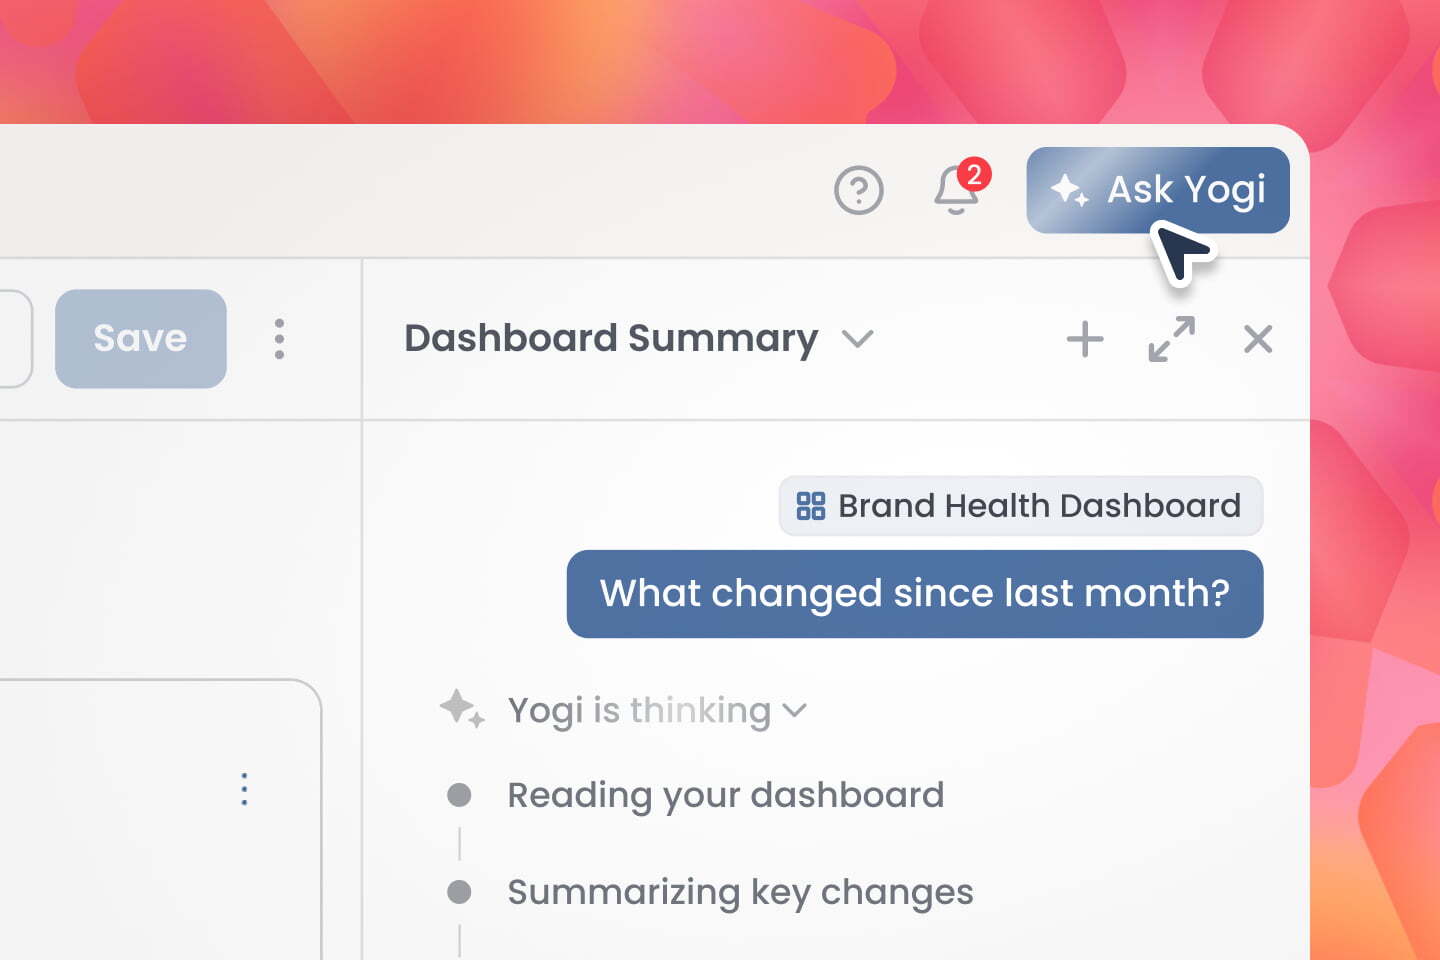
Ask Yogi is now accessible via a side panel that moves alongside you, so your chat and your data are side by side. And because it already knows which chart or dashboard you’re viewing, you don’t have to explain where you are or what you mean. You just ask.
🔍 Understand what you’re looking at
Ask what a chart or dashboard is telling you, what the top takeaways are, or how the data has changed over time. If you’re not sure how to read a chart, Ask Yogi will walk you through it.
🛠️ Make changes without hunting for controls
Want to see the same view by retailer instead of brand? Narrow it to one product line? Add a tile, remove one, or reorder the page? Just say so. Ask Yogi updates the filters, breakdowns, and layout for you.
📊 Build something new from a single prompt
Describe what you want to see, like “Show me a bubble chart for our top five products,” and Ask Yogi builds it. Not sure where to start? It can recommend a template based on what you’re trying to learn. It can also duplicate a dashboard across other brands and countries, so you don’t have to rebuild the same view again and again. Or, it can take an entire conversation you’ve been having to dig into performance questions, and turn it into a dashboard based on all that context.
You stay in control the whole time. Ask Yogi makes the changes, and you decide what to keep by saving the chart or dashboard when you’re happy with it.
What This Looks Like in Practice
It’s Monday morning, and a brand manager has a leadership review at 10. Their team’s dashboard shows a dip in sentiment for their best-selling product, but they didn’t build the dashboard and they’re not sure where to start.
They open Ask Yogi and click the sentiment tile. Then they ask, “What changed since last month?” Ask Yogi compares the two periods and points to a rise in packaging complaints. It also pulls the customer comments behind the trend.
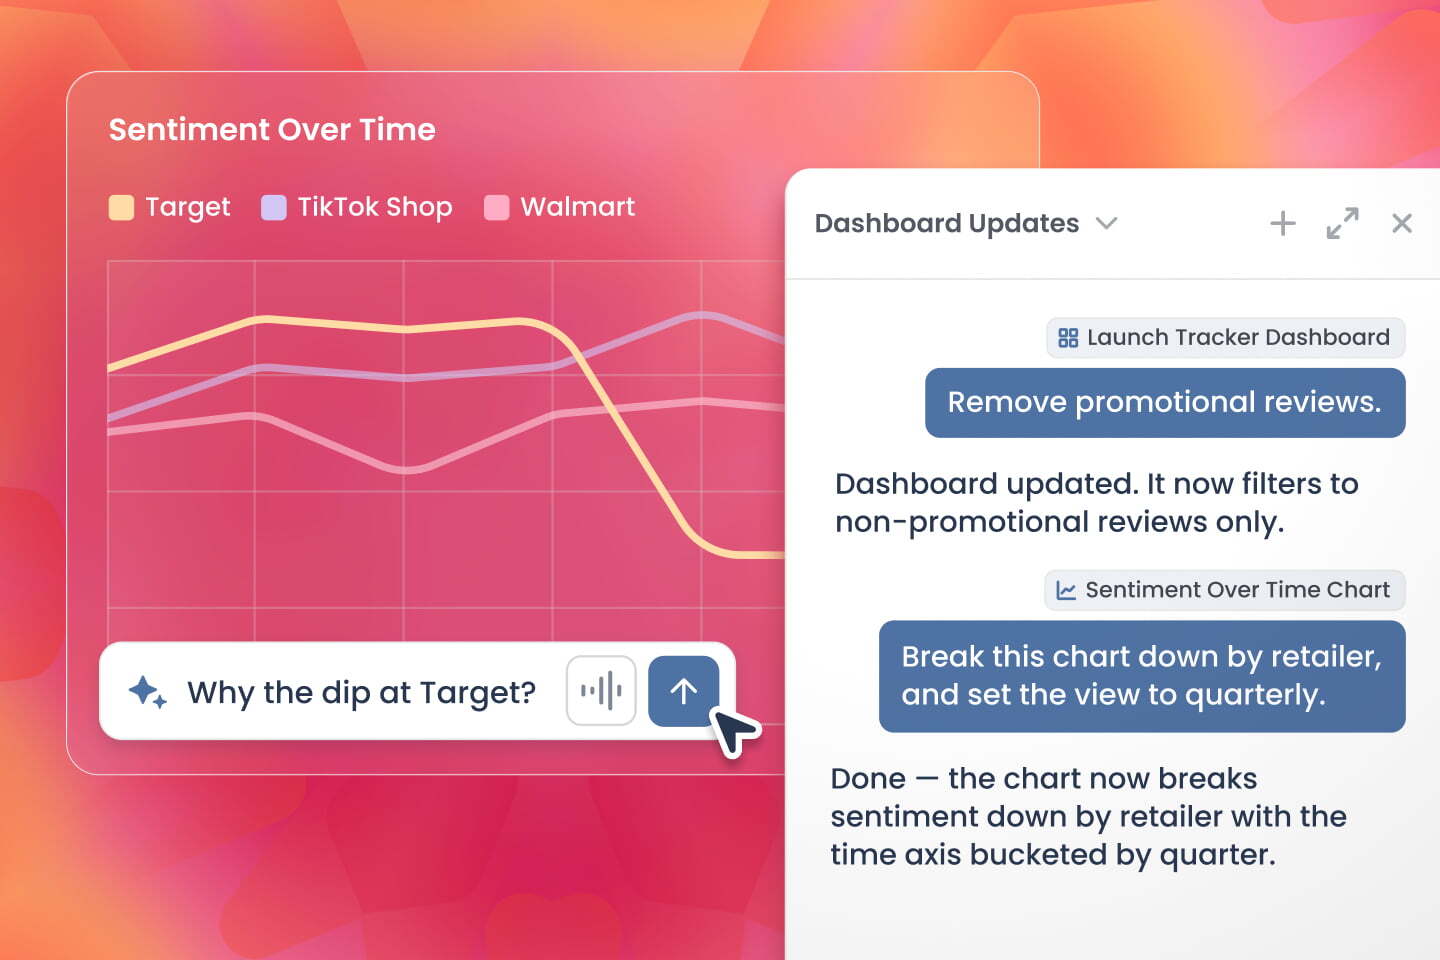
Next they ask, “Break this down by retailer.” The chart updates, and the issue turns out to be concentrated at one retailer. One more prompt exports the view for the meeting.
Total time: minutes. No filters to figure out, no help ticket, no waiting on an analyst in a different time zone who’s not available yet.
Try These Prompts
- “What are the top three takeaways from this dashboard?”
- “How has sentiment on this chart changed since last quarter?”
- “What’s the best way to read this chart?”
- “Break this down by retailer instead of brand.”
- “Create a dashboard tracking our new product launch.”
Built for Experts and Newcomers Alike
For analysts and power users who live in Yogi, Ask Yogi is a faster way to get things done. You can skip the clicks and describe the change you want.
For the brand manager, product lead, or executive logging in for the first time, it’s a way in that doesn’t require knowing how to build a chart at all. That means less time on training, less time stuck on a blank screen, and more people across your organization working from the same consumer truth.
“I used to spend two full days manually analyzing sentiment, running regressions, and surfacing key issues. With Ask Yogi, I get those same results in just five minutes." — Angela Wambach, Product Quality Engineer, Skullcandy
Say goodbye to:
- Hunting through filter menus to change a single view
- Rebuilding the same dashboard for every brand or market
- Staring at a chart and not being sure what it’s telling you
- Waiting on the one data expert on your team for a simple answer
Insights for Everyone, Not Just the Experts
Yogi has always turned scattered consumer feedback into one clear, trusted source of truth. Now, getting answers from that data is as simple as asking a question.
We’ve also refreshed Dashboards to work just like Charts. You get the same chart options and filters in both places, and you edit right on the page.
Unified Intelligence, Finally Within Reach
Ask Yogi cuts through silos and transforms scattered feedback into one continuous thread of truth—accessible to every team, whenever they need it.
It’s fast, defensible, and finally, actionable.
If you’ve ever wished for a way to get to the “why” behind your data without the delay—it’s here.
For a limited time, book a demo—and ask Yogi anything.